Hello, if you have any need, please feel free to consult us, this is my wechat: wx91due
EEE119 Digital Systems Engineering Assignment
Component Tolerance Modelling and Analysis Using MATLAB
RESIT
INTRODUCTION
AIMS OF THE ASSIGNMENT
1. Demonstrate principles of systems engineering through modelling and analysis.
a. Extreme Value Analysis (EVA)
b. Monte Carlo Modelling
2. Introduce component tolerance concepts.
3. Practise working with and analysing awkward datasets.
4. Develop technical report writing skills.
ASSESSMENT METHOD
A written report describing your calculations, simulations and the conclusions to be drawn from those results to be submitted by midday on 11/08/2025. This will contribute 20 % of your overall EEE119 grade.
ACTIVITY CHECKLIST
• Familiarise yourself with Monte Carlo modelling and extreme value analysis
o See the lecture notes.
o Search the internet for information.
• Brush up on your MATLAB skills if necessary
o See relevant information in the EEE125 course.
o Limited additional information is available on BB in EEE119.
o Make use of the official online MATLAB instructions.
• Read the instructions for the modelling and report writing below
• Complete the EVA calculations and Monte Carlo modelling
• Produce some neat graphs to best represent the work and results• Write a report that includes these results (a template is available on BB)
• Submit your report via the portal on Blackboard
• Submit your code via the portal on Blackboard
INSTRUCTIONS
PREMISE
This assignment is intended to demonstrate how systems can be modelled through fairly simple processes to understand their behaviours. In particular, it will indicate how variations in components can lead to larger scale variations in system performance.
In this exercise, imagine that you work for a company that builds systems that contain many inverting op amp circuits. The resistor manufacturer whom you previously used has folded, and two new resistor manufacturers have entered the market. Your boss has asked you to calculate which company will provide better value and write a ≤ 2-page report justifying the decision.
SPECIFICATIONSAND QUOTES
• The gain of the op amp circuits must be -40, with a tolerance of ± 5. i.e. a gain range of -45 ≤ G ≤ -35.
• You must achieve this by using resistor values of 1 kΩ and 40 kΩ .
• The product yield must be greater than 97.0 %. i.e. At least 97.0 % of the op amp circuits must be within the range stated above.
Fix Corp sell resistors with guaranteed tolerances, at different price points depending on the resistance and tolerance. They make no guarantees about the distributions of resistor values within those ranges. They have given you the following per-unit quotes:
Table 1. Fix Corp quote for per–unit costs.
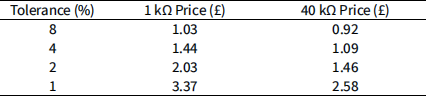
For example, if you wanted to build a unit that contained 1 kΩ resistors with a 2 % tolerance, and 40 kΩ resistors with a 1 % tolerance, that would cost £4.61 per unit. However, using 1 kΩ resistors with a 4 % tolerance and 40 kΩ resistors with an 8 % tolerance would cost £2.36 per unit.
Gauss Corp offer no guaranteed tolerances, but they do claim that their resistor value distributions are Gaussian and will produce resistors with a specified standard deviation (σ) value. They will only accept standard deviation specifications that are whole numbers of percent (e.g. 1.0 %, 3.0 % etc…). The amount that they charge depends on how long they expect it to take them to optimise their production processes to reach a specified standard deviation:
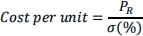
PR is different for the two values of resistor:
• For the 1 kΩ resistor, PR = £5.6
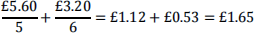
• For the 40 kΩ resistor, PR = £3.20 Example:
If you ask Gauss Corp to make units containing 1 kΩ resistors with a 5 % standard deviation (an absolute standard deviation of 50 Ω) and 40 kΩ resistors with a 6 % standard deviation (an absolute standard deviation of 2.4 kΩ), the price will be:
SUGGESTED ACTIONS
Extreme value analysis
Consider an inverting op amp circuit with a voltage gain, G, of -40. You will achieve this by using R1 = 1 kΩ and R2 = 40 kΩ. You can accept a voltage gain tolerance, ΔG, of ± 5. In the first instance, consider Fix Corp, who will guarantee a certain tolerance of resistor values, ΔR.
1. State an analytical expression for Vo(t) in terms of Vin(t), R1 and R2.
a. What if R1 is at the upper limit of its tolerance and R2 is at the lower limit of its tolerance?
b. What if itʼs the other way around?
2. Using your equations from part 1, calculate the gain tolerance range for each of the resistor tolerance permutations in Table 1.
3. What is the cheapest permutation of resistors that will guarantee that your op amps will all be within the stated gain tolerance?
Monte Carlo simulation
Now consider Gauss Corp, who will not guarantee a hard cutoff of resistor values. However, they do promise a Gaussian distribution of resistor values with a specified standard deviation.
Following these steps, you will produce a Monte Carlo model of the inverting op amp. The model will calculate the circuitʼs gain repeatedly using randomly generated resistor values based on nominal resistor values and a given standard deviation. This will produce a distribution of gain values, which will enable you to predict manufacturing yields.
Recommended steps for the MATLAB programming (youʼre welcome to find your own way to complete the task if you prefer [but you must use Monte Carlo modelling and MATLAB!]):
1) Firstly, produce a 2-dimensional array to store all of your yield values later in the programme.
2) Decide how many instances ofthe simulation you want to run for each pair of σ values. Call this something sensible, like “number_of_runs”.
3) You will need to use nested “for” loops to cycle through the R1 and R2 σ values (remember that Gauss Corp state that the σ values must be integers!). In the nested loops, perform the following actions:
a. First create an array of resistor values for R1.
i. You should populate the array of length number_of_runs with random resistor values based on a Gaussian-style distribution. This can be done using the Randn() function in MATLAB. There is information about this on Blackboard and on theMATLAB website.
b. Repeat this for R2.
c. Create an array of gain values calculated from those resistor values.
i. This means dividing each number from the R2 array by the corresponding number from the R1 array and using the outputs to produce an array representing the resulting gains. (Hint: you can use the “./” operator divide each value in one array by its corresponding value in the other array).
d. Plot a histogram of these results (make sure to label the axes and make the text big enough to read in your report!) – you donʼt need to show me all of your histograms, but show me one or two so that I can see if your code has worked.
e. Interrogate the gain array to determine how many gain values are within your tolerance. Divide this by the total number of calculations to find the yield.
f. Add the yield value to your 2D yield array.
4) Export your yield value array (I suggest using the “writematrix” command).
5) Calculate the price associated with each combination of tolerances.
6) Determine which resistor combination meets the 97.0 % yield with the lowest cost.
The report
The report must be no longer than 2 pages long. It should include:
• A brief introduction to the problem
• A short methodology
• An overview of the key results (including one or two of your histograms)
• A concluding section, highlighting and justifying your choice of company to work with.
A report template is available on Blackboard.
General report writing tips
• Make sure the report has a nice narrative flow
o Check that your sentences sound sensible if you read them out loud
o Make sure that you donʼt randomly just around between different topics. Try to make each sentence flow nicely into the next.
• Be careful formatting your figures. Make sure that:
o The axes are clearly labelled
o The axes show units (or “AU” [arbitrary units] if not applicable)
o The axis text is large enough to read (comparable to the body text size)• Write lots of drafts! It is common for students to sit and stare at a blank page for ages. Try writing down what you know, even if it doesnʼt come out right at first. Once you have a first draft, you can work to improve it. Itʼs very difficult to do that if itʼsjust a blank piece of paper!
• Remember to avoid plagiarism!
o I expect and hope that you will discuss the assignment with your peers and share ideas about how to approach the assignment.
o You MUST avoid plagiarising or colluding on the report.
o There are online resources available to help you avoid plagiarism and collusion