Hello, if you have any need, please feel free to consult us, this is my wechat: wx91due
MATH5007 Assignment 3: Simulation
Total: 240M
Question 1: General (60 Marks)
The part is a short general understanding and exploration question.
1. For Multi-Objective Optimisation, we used a two-step approach to solve the mining problem. Explain this process, i.e. the second part, IN YOUR WORDS. You can use the mining problem as an example. 10M
2. Provide in your own words a short explanation of how discrete event-oriented simulation works. Use a short example like a source, queue and delay entity. (MAX 200 words) 10M
3. You are running a successful business and plan to upgrade and extend the production line. You are advised to run a simulation beforehand and also hire an external company to lead the modelling rather than use one of your employees. Discuss if the advice is appropriate and include benefits and risks in your answer. 15M
4. Explain the difference between Linear and Non-Linear Optimisation. 5M
5. Reflecting on the AMPL part of the unit, answer the following questions.
a. What is the most important part when starting optimization (and simulation) projects? (5M)
b. Are you proud that you achieved the unit goal, learning to write models? (5M)
c. Looking back, what could you have done differently? (5M)
d. What was the most challenging part, which part do you consider most important or relevant? (5M)
Question 2: Larger Simulation Model (40M)
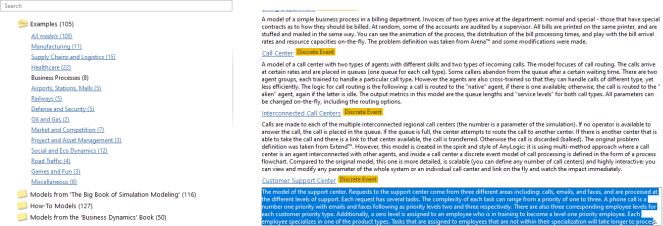
AnyLogic has an extensive library with example models (Help Menu). In this task, you should explore the “Customer Support Center” example by 1) running the model with different settings and 2) looking at the model itself. The model uses more features, entities, and programming than we covered in the unit. However, you will see similar implementations to our example. Please do (at least) the following tasks:

1. Start the simulation, run it with the given experiment and explore what and how the simulation works (no details, very general top-level understanding). Slow the simulation time to see how “agents” are moved. Provide a summary of the simulation and what is reported back. Do not describe each single entity or output; this is a summary. (10M)
2. While the simulation runs, you can change the incoming calls, emails, and faxes. Modify these values and observe the impact. Do not change the parameters on the initial starting screen. What are your observations? Is there a limit where you believe that the support centre cannot operate anymore? (15M)
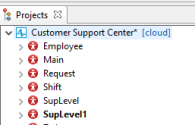
3. In the Projects overview, go to SupLevel1 and look at the logic given here. Explain the process that is modelled here. Note that you should cover the process in general. However, it is unnecessary to include all details (e.g., some of the programming is more than we covered in class, so there is no need to explain all parameters or statistics). Also, there are entities not covered; look at their description and include as good as possible in your explanation of the process. Further, it is not necessary to explain how it is integrated into the main simulation model; the focus is on the logic given in this part of the model. (15M)

Question 3: Simulation Model (140 Marks)
You are offering a return service for glass containers and need to plan the best possible operation mode for the service. The shop has a number of machines that the customer has to use to return the containers. The front part of the store is relatively small, so only a limited queuing area can be provided. The following setup should be used for the simulation; more details are below. Note that is might help to add some screenshots to this document to reflect the changes or results.
· The model’s name should be ID_lastname_bottle
· Simulation should run with minutes as time unit.
· Random seed number is 10.
· The simulation time should be 480 time units.
· The execution mode is real-time, with a scale of 1.
· The customers arrive with an interarrival time that is exponentially distributed with a mean of 60 per hour.
· The source and the agent Customer and Bottle is given in the provided model. The customer has a parameter bottles set at the exit to a random number (0-9) representing the number of returning bottles.
· Customers arriving at the store with no bottles leave immediately through the exit (use entity SelectOutput.
· Next, they use the provided service to return the bottles (using a queue length of 10 and a triangular delay time distributed with ~(0.3, 0.5, 1.0) minutes. Customers can use the preempt exit in case of a full queue. Use a resource pool with machines (one per customer; the capacity of the resource pool is initially 1).
· Afterwards, the customer has to get their money (Triangular Distribution with ~(0.5, 1, 3) minutes). The queue can be set to 100. It is not expected to be long and should be evaluated with the model. There is no preempt option, as all customers have to get their money returned. A worker is needed for the payment service. Use a resource pool.
· Only one worker is currently hired.
· The returning bottles must be packed in bundles of 50 before leaving the system. To do this, an entity split is used. This entity allows the creation of new agents (existing through the exit marked with a +. The number of copies should be the number of bottles the customer returned, and the new agent (copy) should be of the type Bottle.
· The bottles are packed using the entity batch (Batch Size 50, it is a permanent batch, and the new batch is an agent Bundle. You need to create this agent. The bundles need to be prepared before leaving the system, using an entity service (unlimited queue, service takes a triangular distributed time of ~(0.5, 1, 5) minutes
· Workers decide the priority of attending a service based on the value in the service entity “Task Priority.” Use 100 for the packing and 10 for the payment.
a) Run the model and report on the following stats: (40M)
· Utilization of the machine and worker (>=90%, 40-60%):
· Number of customers who left successfully or left because of a long queue (early >220, successfully >180):
· Number of packed batches (13-20):
b) Implement multiple statistical visualisations (20M).
· Start with a histogram for the number of bottles the customer returns. The display should have 10 intervals, with fixed values from 0-10. The data can be added in the entity SelectOutput by adding in the “On exit (true)” the line “NAME OF DATA.add(agent.bottles)”.
· Add a barchart for each resourcepool (it can be in the same visualization). The data can be read from the resourcepool by using the function utilization() (e.g., worker utilization()).
· Add a timeplot for the size of the queue, it should have a time window of 480.
c) What other observations do you have? Do you consider this simulation result as good and a possible scenario for the shop? Explain your answer. (5M)
d) Run some experiments with more machines and workers. What would you suggest for the number of machines and workers considering the setup? (5M)
e) The store receives feedback that the service with just machines is too impersonal, and some customers prefer interaction with a worker to return the bottles. It is expected that 20% would choose the worker over a machine. Add a service to return the bottles, including a Select Output. The distribution is the same as for the machine; the queue length is 100, task priority is 10. And there is only room for one person to provide this service at a time. Use 3 machines and 2 workers, run the model. Are there any observations that are not satisfying? Report any number that seems relevant. (20M)
f) Add a time measurement for the customers from entering the store to leaving. Add the start before the SelectChoice, the end just after the pay service. Visualise the result of the time measurement with a histogram. For Histogram (the reference to the data), use “name of end time measurement.distribution (e.g., end.distribution). What do you observe in this scenario? (20M).
g) Rerun the simulation to improve the tail of the time in the system (The customer should not have to wait so long). How can this be achieved? (5M)
h) If not done yet, change the model to have two view areas: logic and statistics. Add buttons to switch between them (15M)
i) What could be three other changes or additions to the model that could be made next? Describe these; there is no need to implement them. (10M)
The model to submit is the one you have after doing all the questions and adaptations. Include the .alp file in your submission. Note that it might be better to compress the folder and send the compressed file. Every question has to be addressed in a Word document (you could insert your answer in this document). I am not expecting extensive answers. Be precise and focus on the requested answer. Use screenshots if helpful.
The final submission is sent as an email attachment to [email protected]. Use your Curtin email account. The submission should be a Word document with all of your answers to the questions (you can use this file and insert your answer in a different colour) and the simulation model. The word document has to be submitted to Turnitin as well.