Hello, if you have any need, please feel free to consult us, this is my wechat: wx91due
CS 330, Spring 2025, Homework 9
Due Thursday, April 24, 11:59 pm EST, via Gradescope
Homework Guidelines
Collaboration policy If you choose to collaborate on some problems, you are allowed to discuss each problem with at most 3 other students currently enrolled in the class. Before working with others on a problem, you should think about it yourself for at least 45 minutes.
You must write up each problem solution by yourself without assistance, even if you collaborate with others to solve the problem. You must also identify your collaborators. If you did not work with anyone, you should write ”Collaborators: none.” It is a violation of this policy to submit a problem solution that you cannot orally explain to an instructor or TA.
Typesetting Solutions should be typed and submitted as a PDF file on Gradescope. You may use any program you like to type your solutions. LATEX, or “Latex”, is commonly used for technical writing (overleaf .com is a free web-based platform for writing in Latex) since it handles math very well. Word, Google Docs, Markdown or other software are also fine.
Content of the Solution. When a problem asks you to design an algorithm, a complete (a.k.a. full credit) solution always consists of a description of the algorithm using pseudocode (thus not actual code) with well-chosen comments, preferable some short and high level description in English so that the reader has an idea of what the code does, a proof of the correctness of the algorithm and a running time analysis.
Filling in a Contingency Table
You work for a government agency (such as the US Census Bureau) that conducted a survey to find out race and ethnicity data across different age groups. There are 128 possible ethnicities and 100 possible ages. They constructed a 100 x 128 size table, where each entry represents the number of people in the survey of a particular age and particular ethnicity. They published the row and column sums for this table, given as R = [R1, R2, . . . R100] and C = [C1, C2, . . . C128] respectively.
Unfortunately, the original data in the table was lost, due to a hard drive failure and poor backup protocols. All that was salvaged was:
• The row and column sums; and
• A list of table positions (that is, pairs (i, j)) that are known to be 0. This list doesn't contain all the positions that are 0, but everything on the list is 0 for sure.
• (*) (used for part 2 of the problem) A list of table positions (x, y) that are known to have at least one person, thus the value assigned to (x, y) is at least 1 . (Again, this list need not contain all such positions.)
1. (7 points) Write an algorithm to reconstruct a possible table (that is, a table with the right row and column sums, with zeros in the positions known to be 0). In this part of the problem you don’t have to consider the lower bounds on table positions as described in (*).
There may be many possible solutions; your algorithm just needs to find one.
To analyze the running time, suppose that there are k rows and t columns, and p people who participated in the survey. Your algorithm should run in time O(pkt).
Table.jpg
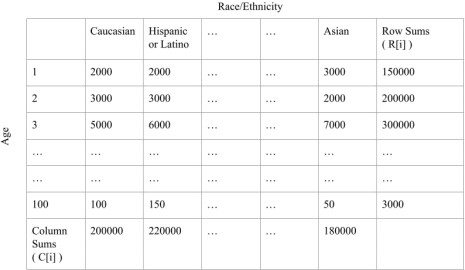
Figure 1: An example of Census Data Before the Data Was Lost
2. (3 points) Modify your previous algorithm to take care of the third requirement marked by (*). That is, there is a second list of positions given as input of the cells that are required to have value at least 1. We are aiming for the same running time of O(pkt). In the proof it’s enough to prove the correctness of the modifications. In your algorithm you can call the graph creation process from part 1 and then apply the modifications to the graph and the algorithmic process as needed. (You can give a complete solution for part 2 only and receive the full 10 points if this is correct. However, it’s easier to think about in two steps. If you want to play it safe you may be better off doing the two parts separately.)
Notes and Extensions This is not part of the homework assignment, but interesting to think about!
1. The premise for this problem is unrealistic, since the Census Bureau very rarely loses data. However, they really do face a computationally similar problem. Because of privacy concerns, the Census sometimes computes row and column sums, adds some noise to those, and then publishes a table that is consistent (or as consistent as possible) with those noisy row and columns sums, subject to known constraints like the fact that some cells are emptythere are no 10-year old grandmothers and other cells have to have a person (e.g. nursing homes homes only appear in the data if they have at least one occupant). The real Census version is actually much more complicated, because the data has dozens of attributes instead of just two (age and ethnicity). But the flavor is similar.
2. Do not hand in: How could you modify your algorithm to see if there is more than one possible table? How could you modify the algorithm to take upper ui;j and lower bounds {i;j on the value of each cell?