Hello, if you have any need, please feel free to consult us, this is my wechat: wx91due
Statistics 110, Statistical Methods for Data Analysis I Practice Final Exam
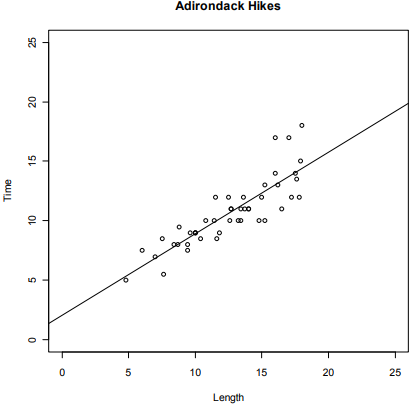
1. The scatterplot below shows the regression fit to predict Y = the typical time of a hike in the Adirondack Mountains (in New York) using X = length of the hike (in miles).
a. Add three new data points to this plot that would clearly have the properties listed below. Label them as A, B and C:
Point A: Influential but not an outlier
Point B: Residual near zero & large leverage
Point C: An outlier but not influential
b. Could any of the three points you added in Part (a) have been on top of each other?
Explain. 
2. Why is it better to use adjusted R2 rather than R2 when comparing multiple regression models?
3. Explain briefly what the Variance Inflation Factor (VIF) tells us about a multiple regression model coefficient.
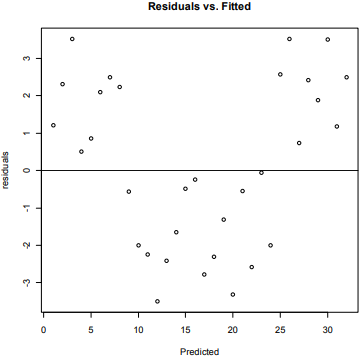
4. The plot below shows residuals versus fitted values after fitting a linear regression model. Of the
four conditions of linearity, equal variance, normality and independence, choose two and discuss
whether or not they appear to be met based on this plot. 
5. A guidebook contains information on the Distance (miles), average Time (minutes) and Elevation gain (feet) for a sample of 72 day hikes in Southern California. Below is some R output from a simple linear regression model to predict the Elevation gain using the hike Time.
Coefficients:
Estimate Std. Error t value Pr(>|t|)
Constant 137.24 75.12 1.83 0.072
Time 1.9195 0.625 3.07 0.003
---
Signif. codes: 0 ‘***’ 0.001 ‘**’ 0.01 ‘*’ 0.05 ‘.’ 0.1 ‘ ’ 1
Residual standard error: 336.103 on 70 degrees of freedom
Multiple R-squared: 0.119, Adjusted R-squared: 0.106
F-statistic: 9.42 on 1 and 70 DF, p-value: 0.003
a. Write a sentence that interprets the value of the estimated slope of the model in the context of this data situation.
b. Write a sentence that interprets the value of R2 (not adjusted) in the context of this data situation.
c. What would you conclude about the usefulness of using hike time to predict elevation gain? Give statistical justification for your answer.
6. When examining case diagnostics in multiple regression, under what circumstance is it acceptable to remove a case that is clearly a Y outlier?
7. Give two circumstances in which it is acceptable to remove one or more cases that are outliers in the X variables.
8. Suppose you have four possible predictor variables (X1, X2, X3, and X4) that could be used in a regression analysis. You run a forward selection procedure, and the variables are entered as follows: Step 1: X2 Step 2: X4 Step 3: X1 Step 4: X3 In other words, after Step 1, the model is Y = β0 + β1X2 + ε After Step 2, the model is Y = β0 + β1X2 + β2X4 + ε And so on…
You also run an all subsets regression analysis using R2 as the criterion for the “best” model for each possible number of predictors (1, 2, 3, 4). Would the same models result from this analysis as from the forward stepwise procedure? In other words, would “all subsets regression” definitely identify the following as the best models for 1, 2, 3, and 4 variables? Circle Yes or No in each case.
a. β0 + 1 variable, best model would be Y=β0 + β1X2+ ε YES NO
b. β0 + 2 variables, best model would be Y=β0 + β1X2 + β2X4+ ε YES NO
c. β0 + 3 variables, best model would be Y=β0 + β1X2 + β2X4 + β3X1+ ε YES NO
d. β0 + 4 variables, best model would be Y=β0 + β1X2 + β2X4 + β3X1 + β4X3+ ε YES NO
9. An international company is worried that employees in a certain job at its headquarters in Country A are not being given raises at the same rate as employees in the same job at its headquarters in Country B. Using a random sample of employees from each country, a regression model is fit with: Y = employee salary
X1 = length of time employee has worked for the company
X2 = 1 if employee is in Country A, and 0 if employee is in Country B.
New employees, who have X1 = 0, all start at the same salary, so the company is not interested in fitting a model with different intercepts, only with different slopes.
a. Write the full and reduced models for determining whether or not the slopes are different for employees in the two countries, using the variable definitions above and standard notation.
Full model:
Reduced model:
b. For the full model, write the population model for an employee with 10 years of experience in Country A, and then write the model for an employee with 12 years of experience in Country B.
10. Consider a two-factor experiment in which one factor is “Restaurants” and five restaurants are used in the study. Give a set of circumstances under which the restaurant factor would be considered fixed, and a set of circumstances under which it would be considered random.
11. Sketch a picture of possible cell means (i.e., an interaction plot) for the following scenarios: a. Factor A has 3 levels, Factor B has 2 levels. There is an AB interaction, but no A or B main effects. b. Factor A has 3 levels, Factor B has 2 levels. There is an effect for Factor A, but no interaction and no Factor B effect.
12. A study was done to see if meditation would reduce blood pressure in patients with high blood pressure. There were 100 people available for the study. Half of the patients were randomly chosen to learn meditation and told to practice it for half an hour a day. The other half was told not to alter their regular daily routine. Blood pressure measurements were taken at the beginning of the study, after 5 weeks, and after 10 weeks.
a. Is this a randomized block design? Explain why or why not.
b. One factor in this experiment is “Meditation group.” How many levels does that factor have, and what are the levels?
c. Another factor in this experiment is “Time period.” How many levels does that factor have, and what are the levels?
d. Are the factors “Meditation group” and “Time period” crossed, or is one of them nested under the other? Explain.
13. Comment briefly on the following statements:
a. In one factor ANOVA where the factor is fixed, a highly significant F statistic (p < .001) indicates that the K population means, μ1 to μK are all different.
b. In one factor ANOVA, we need to use multiple comparisons (like the Tukey procedure) because it is impossible to compare K means all at once.
14. A student analyzed data for a one-way analysis of variance situation for which there were 3 levels of the factor, and 21 people measured at each level. Unfortunately, after running the analysis, the student lost the computer output. She said “All I remember is that one of the mean squares was 100 and the other one was 500, but I can’t remember which was which. Oh, and I remember that the pvalue for the test was about .01.” Based on this information, can you construct the analysis of variance table? (I’ve provided headings to remind you of the table structure.) If so, fill it in. If not, explain why not. If you think you can partially fill it in, do that.
Source SS df MS F p-value