Hello, if you have any need, please feel free to consult us, this is my wechat: wx91due
Econ 102 Homework #9 AD/AS and The Phillips Curve
1. As on previous homework assignments, turn in a news article together with your summary and explanation of why it is relevant to this week’s topic, “AD/AS and The Phillips Curve.”
2. If the government increases its purchases by $100 billion, how will this shift the aggregate demand curve? Under what circumstances would it shift horizontally by exactly $100 billion? What aspects of economic behavior would cause it to shift by more than $100 billion? What aspects would cause it to shift by less?
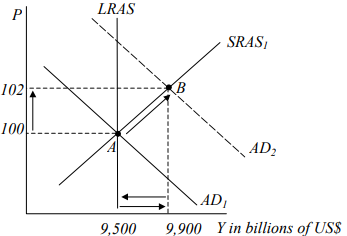
3. Suppose that the US economy is initially, in the year 2003, in long-run equilibrium with zero inflation and the natural rate of unemployment, as shown at point A in the following figure. Assume that the labor force in the US totals 100 million people. Assume further that the following is the aggregate production function:
Y = 100,000L
where Y is real GDP in US$, and L is the number of employed labor.

(a) Find the natural rate of unemployment.
(b) Suppose now that in the year 2004 a fiscal expansion takes the economy to point B on the above graph. Calculate the unemployment rate for 2004 and the inflation rate that has occurred from 2003 to 2004.
(c) What is the equation of a typical short-run Phillips curve? What does it imply about the relation between the inflation rate and the unemployment rate in the short-run? What is the effect of an increase in expected inflation?
(d) What was the expected inflation rate in the initial long-run equilibrium at point A above?
(e) Using the initial long-run equilibrium point A, together with point B, find the value for the parameter a of the short-run Phillips curve.
(f) Draw the short-run Phillips curve that you found, labeling the coordinates of the points on it that correspond to points A and B above.
(g) Suppose now that the Fed begins to manage the money supply so as to keep the inflation rate at 2% in 2005 and subsequent years. Show in the figure that you’ve drawn where you would expect the economy eventually to end up. Describe in words the path that it might take to get there.
4. Suppose the natural rate of unemployment is 6 %. On one graph, draw two Phillips curves that can be used to describe the four situations listed below. Label the point that shows the position of the economy in each case: a) Actual inflation is 5% and expected inflation is 3%. b) Actual inflation is 3% and expected inflation is 5%. c) Actual inflation is 5% and expected inflation is 5%. d) Actual inflation is 3% and expected inflation is 3%.
5. Illustrate the effects of the following developments on both the short-run and the long-run Phillips curves. Give the economic reasoning underlying your answers.
a) a rise in the natural rate of unemployment
b) a decline in the price of imported oil
c) a rise in government spending
d) a decline in expected inflation