EE3008A/B – Linear Systems and Signal Processing
Department of Electrical Engineering
MATLAB Exercise for Hw 3
In this lab, we will see how the signal behaves when going through a system that uses a sinusoidal carrier for amplitude modulation. Again, of course, it will be done under the help of MATLAB program.

It is recommended for you to use the same piece of music as used in the previous two exercises, so that you can see and hear how the signal is transmitted and how distortion takes place in a real communication system.
1. Load the music waveform into MATLAB
2. Extract a 10s clip from the original music
3. Apply Fourier Transform to the music clip using the
function fft_PolyU( )
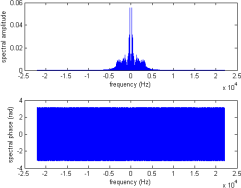
Here is the original signal spectrum that we have already obtained from the previous exercises.
4. In the time domain, multiply the signal with a sinusoidal carrier.
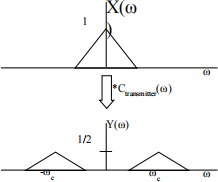
We first recall that multiplication in the time domain refers to convolution in the frequency domain. For convenience, we choose the sinusoidal carrier to be cos ωct, setting θc=0.
Therefore, multiplying the signal with cosωc indicates that signal’s spectrum convoluting with the carrier’s spectrum.
Applying Dirac function’s properties in convolution, we get that
In MATLAB, we write the following command, suppose your time domain signal vector is named as signal, and if we choose the carrier frequency to be 8kHz,
fc=8000;
signal_mod=signal.*cos(2*pi*fc*t);
%
signal_mod=signal.*transpose(cos(2*pi*fc*
t));
% if the dimension of two vectors don’t
match
Note here t is the time vector that we have already defined when using the fft_PolyU( ).
5. Apply Fourier Transform to the modulated signal
Below is the spectrum graph of the modulated signal
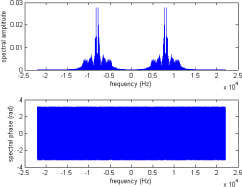
Comparing the spectrum before and after modulation, what
we expected to see from theory coheres with the real case. 6. In the time domain, apply demodulation also with
sinusoidal carrier
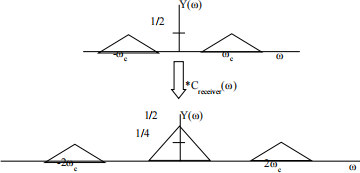
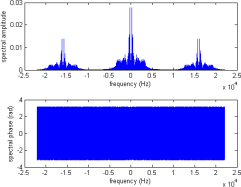
Demodulation is done by multiplying the modulated signal with another sinusoidal carrier in the time domain. We now assume using sinusoidal carrier that has the same frequency with the carrier on the transmitter side, which is 8kHz in our case. By mathematical induction, we expect the spectrum on the receiver side to be
If we plot the spectrum of the modulated signal, we obtain
the following graph
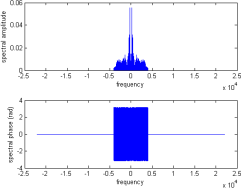
7. Apply a low-pass filter which has amplitude 2 to the demodulated signal spectrum.
Here you may define the cut-off frequency of the low-pass filter as 4KHz or 5KHz as appropriate.
After the filtering, plot the signal spectrum again, now your graph should look like this
8. Apply inverse Fourier Transform to the filtered
signal, play it and compare it to the original signal.
Does there exist any distortion?
9. Repeat the same process with carrier frequency of 1 kHz. Is there any distortion in the reconstructed signal?